How to interact with the result layouts
My first steps
Create a Diggle
- Interactive slides
- Content slides
- Create a test with a passing grade
- Create and run a quiz
- Customize logo
- Collaborate on content creation
- Merge slides
- Select question types
- Colors and styles
- Add images
- Custom fonts
- The Content Tab
- The Design Tab
- Import from other Diggle
- Import from PPT or PDF
- Leaderboard Calculation
- Register Participant Information (RPI)
- Quiz Points Calculation
Question types
Present live
- Present using Fullscreen
- Interactive Result Layouts
- Display the QR code
- Open and Close Submission
- Show results on devices
- Sneak Peek functionality
- Change Navigation Pace
- Hide Login Details
- Share the presentation screen
- Present on a Separate Display
- Present using Backstage
- Presentation Modes
- Navigation Modes
- Quick Onboarding
Invite participants
Results & Reports
Collaborate with others
AI - Diggle Buddy
Company Workspace
Account and settings
GDPR
Security
FAQ & Troubleshooting
- Join code has expired
- How do I use Diggle for remote learning and surveys?
- My QR code isn´t displaying
- Presentation screen is not displayed
- The leaderboard isn’t calculating scores correctly
- How do I recover a deleted Diggle or session?
- My participants are seeing the wrong slide
- How do I use Diggle for remote learning and surveys?
- How to switch between numbers and percentages
- How to interact with the result layouts
Table of Contents
In Diggle, result layouts offer more than just a visual summary of participant responses.
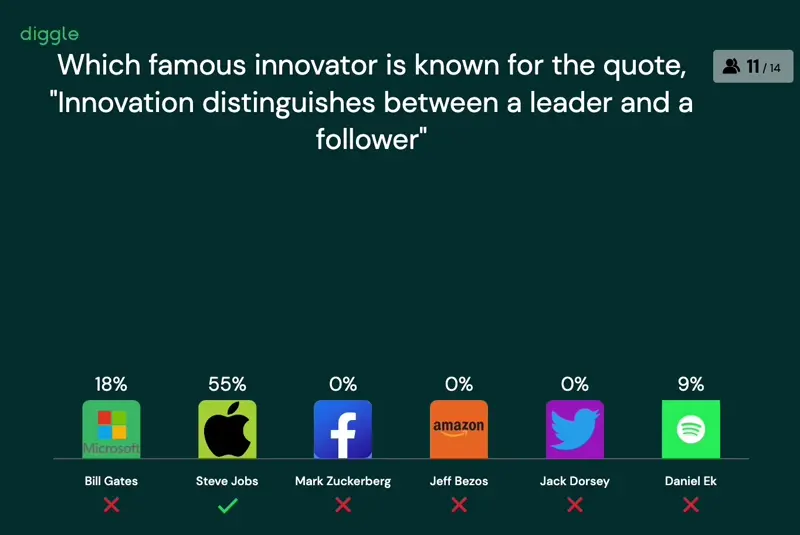
By interacting with the results, you can gain deeper insights into your data, such as identifying who answered what or viewing additional text-based responses. Show the results by pressing ‘R’ on your keyboard or by using the menu bar at the bottom of your screen.
Whether you’re presenting a bar chart, doughnut chart, or any other result layout, clicking on a specific segment (e.g., a bar in a bar chart) reveals further details.
Clicking on a segment will display the participants who chose that option.
This is particularly useful when you need to drill down into who provided specific responses.

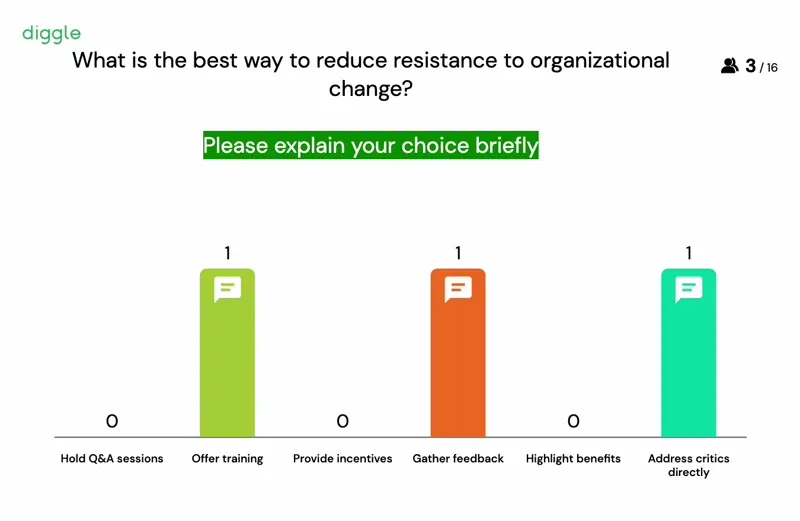
In some question types, such as multiple-choice with the “Explain answer” feature enabled, you can see participants’ additional text responses.
Clicking on the related result segment will show these open-ended answers, providing more context behind their selections.

