Interactive Result Layouts
My first steps
Create a Diggle
- Interactive slides
- Content slides
- Create a test with a passing grade
- Create and run a quiz
- Customize logo
- Collaborate on content creation
- Merge slides
- Select question types
- Colors and styles
- Add images
- Custom fonts
- The Content Tab
- The Design Tab
- Import from other Diggle
- Import from PPT or PDF
- Leaderboard Calculation
- Register Participant Information (RPI)
- Quiz Points Calculation
Question types
Present live
- Present using Fullscreen
- Interactive Result Layouts
- Display the QR code
- Open and Close Submission
- Show results on devices
- Sneak Peek functionality
- Change Navigation Pace
- Hide Login Details
- Share the presentation screen
- Present on a Separate Display
- Present using Backstage
- Presentation Modes
- Navigation Modes
- Quick Onboarding
Invite participants
Results & Reports
Collaborate with others
AI - Diggle Buddy
Company Workspace
Account and settings
GDPR
Security
FAQ & Troubleshooting
- Join code has expired
- How do I use Diggle for remote learning and surveys?
- My QR code isn´t displaying
- Presentation screen is not displayed
- The leaderboard isn’t calculating scores correctly
- How do I recover a deleted Diggle or session?
- My participants are seeing the wrong slide
- How do I use Diggle for remote learning and surveys?
- How to switch between numbers and percentages
- How to interact with the result layouts
Table of Contents
When presenting, you can interact with result displays, like bar charts, wall of text, and doughnut charts, to gain further insights into participant responses.
How to interact with the result layouts
Clicking result displays
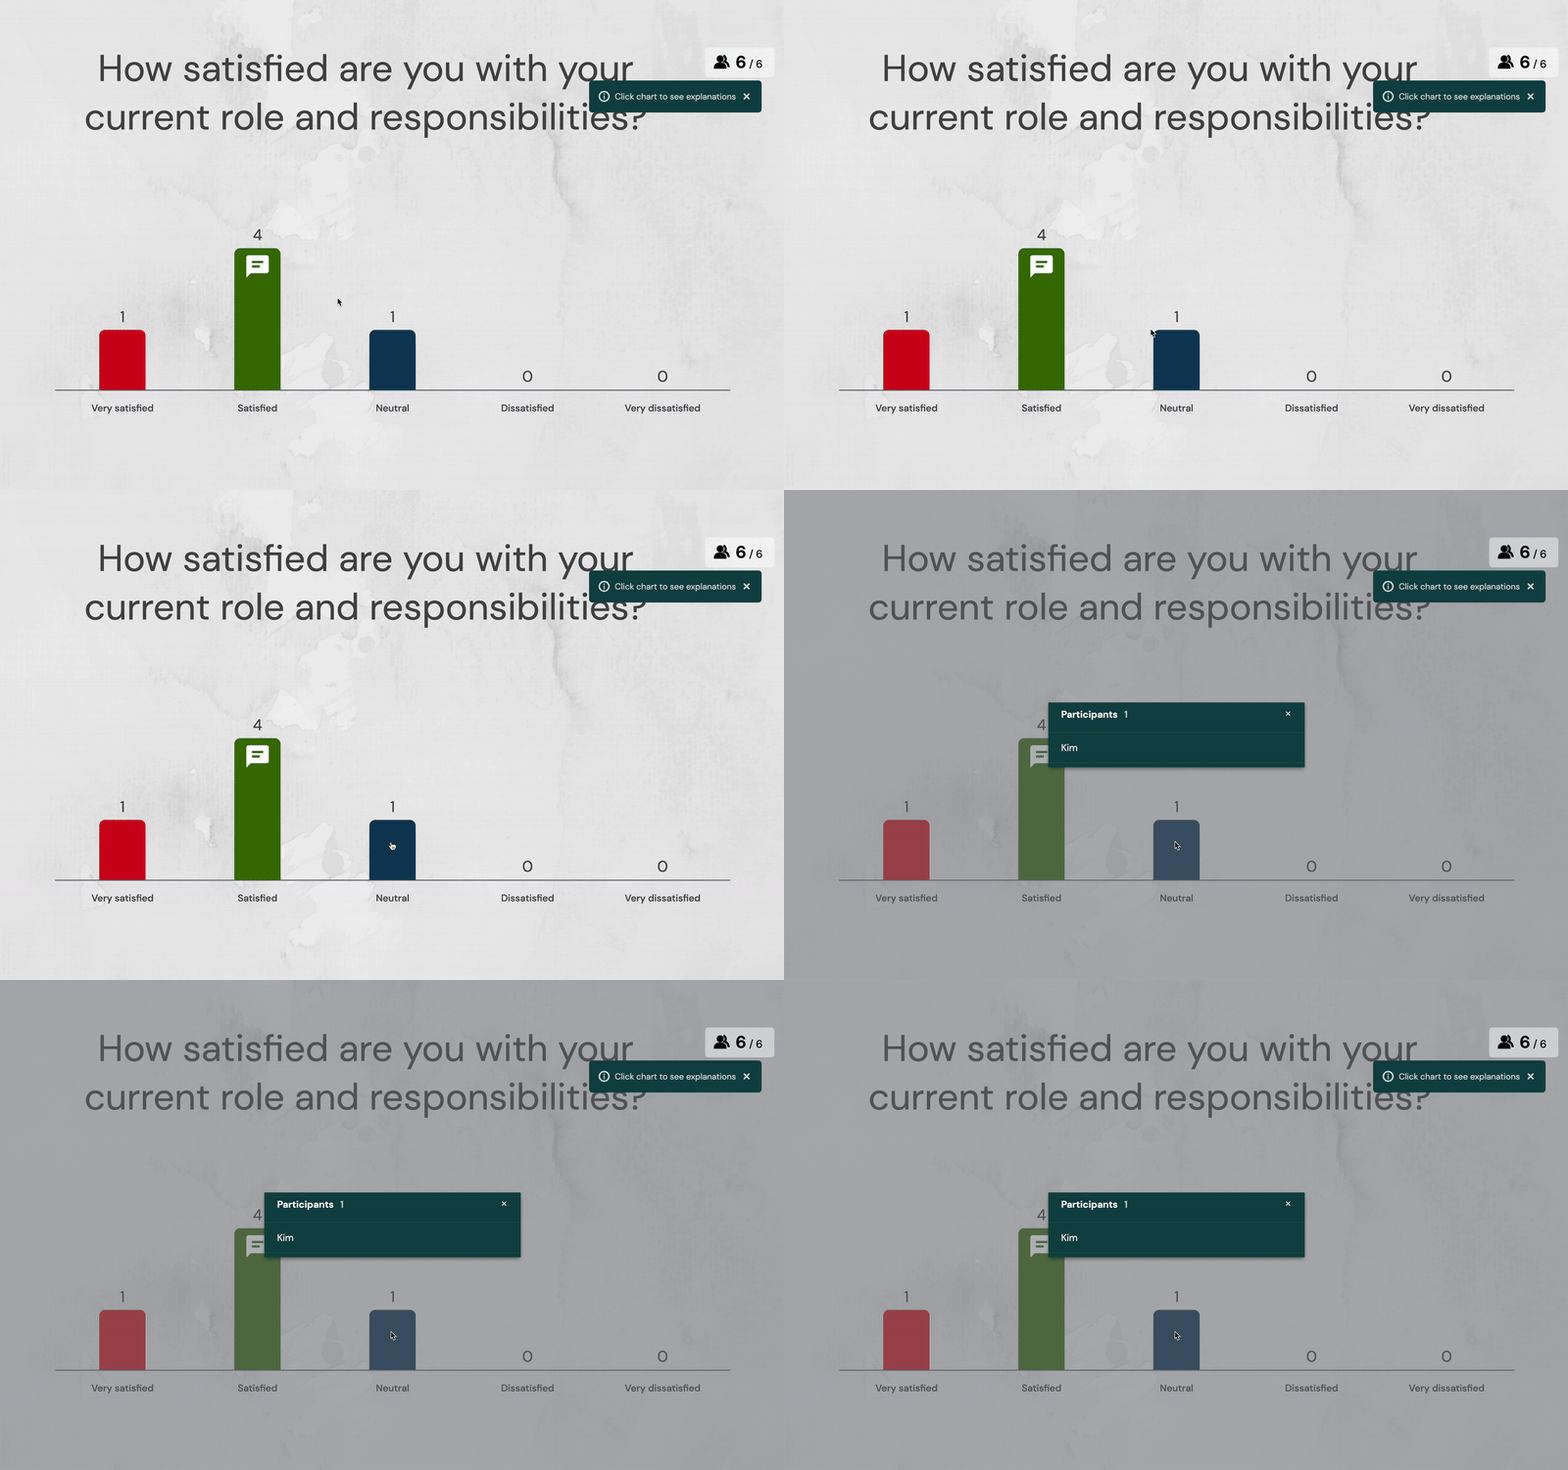
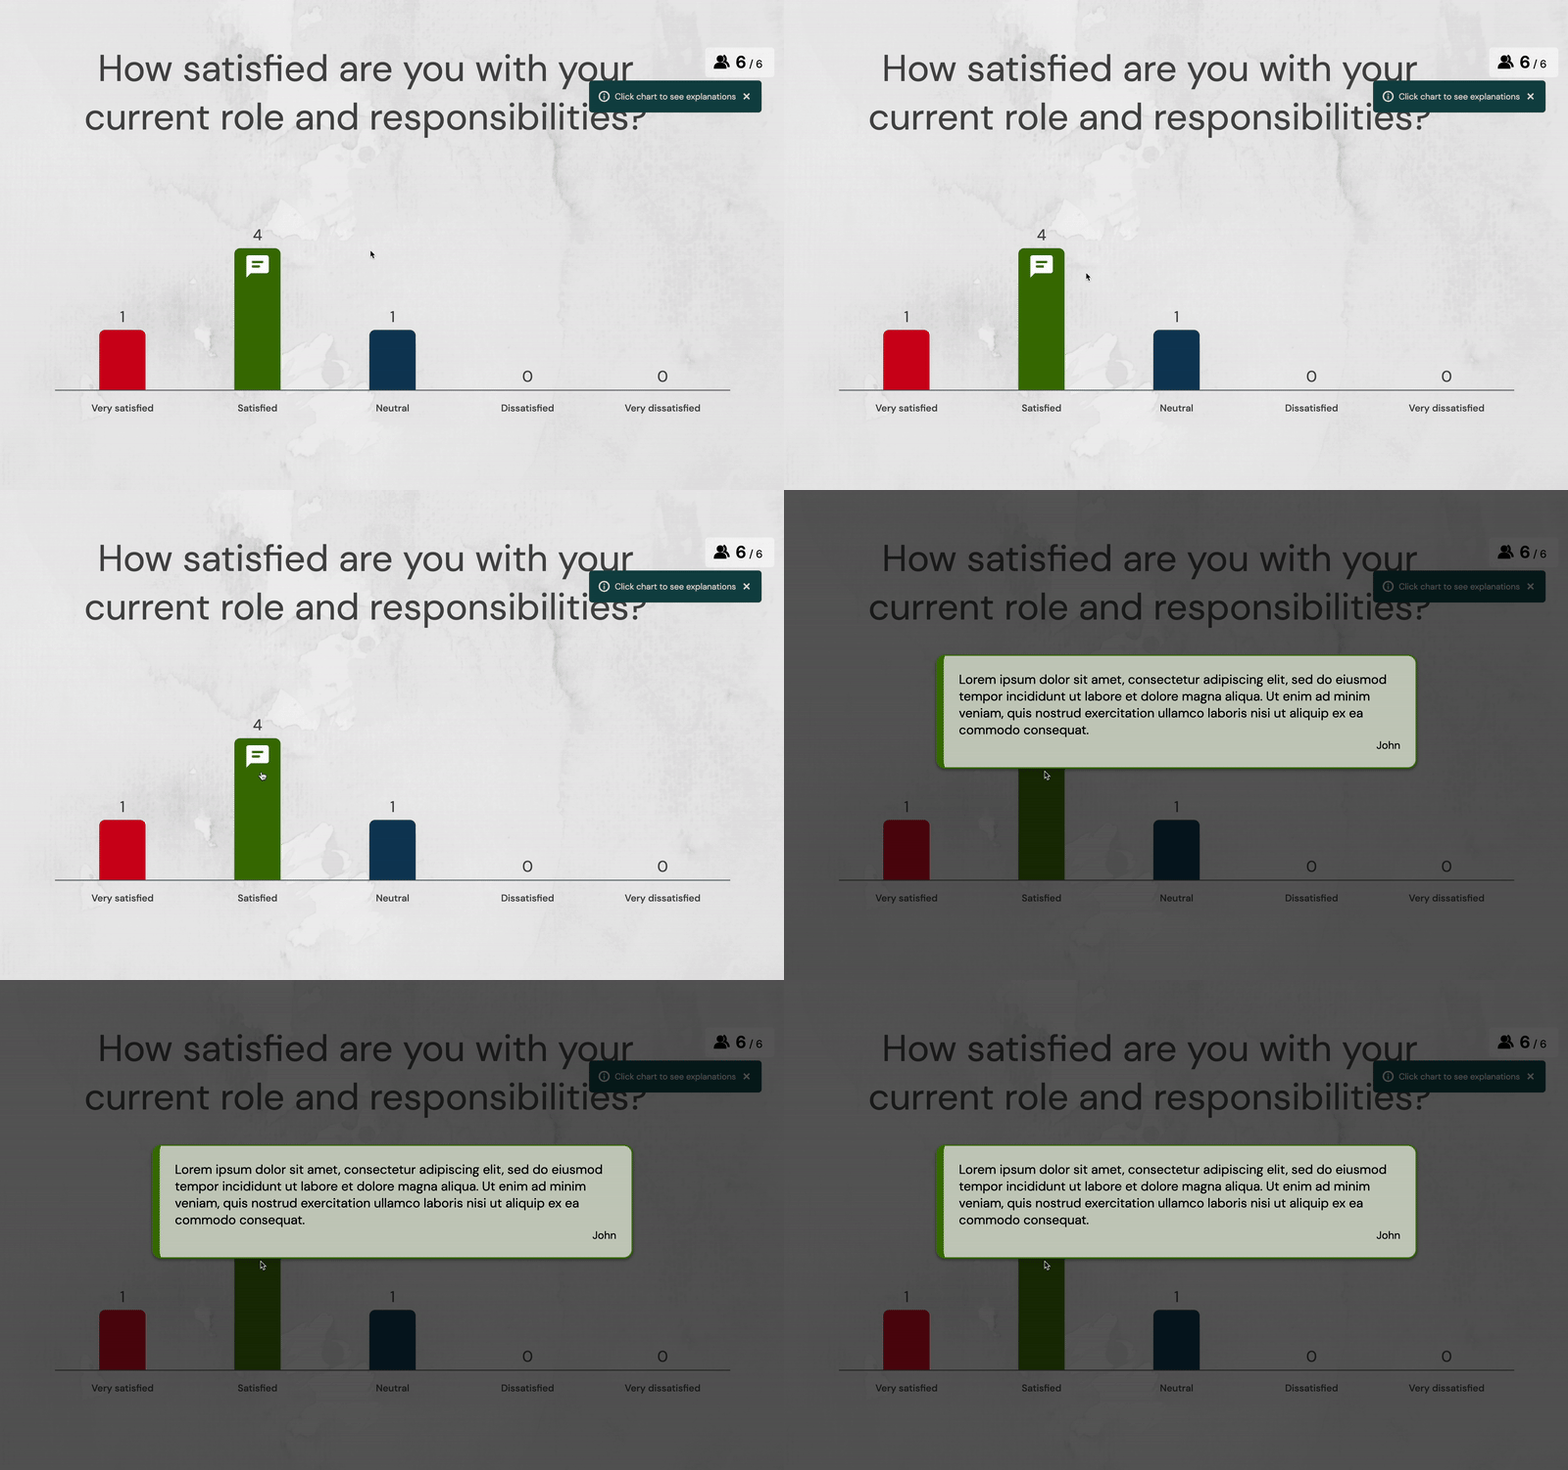
During your presentation, click on any part of the result displays (e.g., a bar in a bar chart or a section of a doughnut chart). This will reveal additional details about that segment.
Identify respondents
Clicking on a part of the display will show a list of participants who selected that specific answer, helping you understand the distribution of responses and see who chose each option.

Additional Text Responses
For questions that allow open-text answers in addition to selection options, clicking on the relevant segment will display these text responses (i.e., Multiple choice with the Explain answer feature activated).

Switch between percentages and numbers
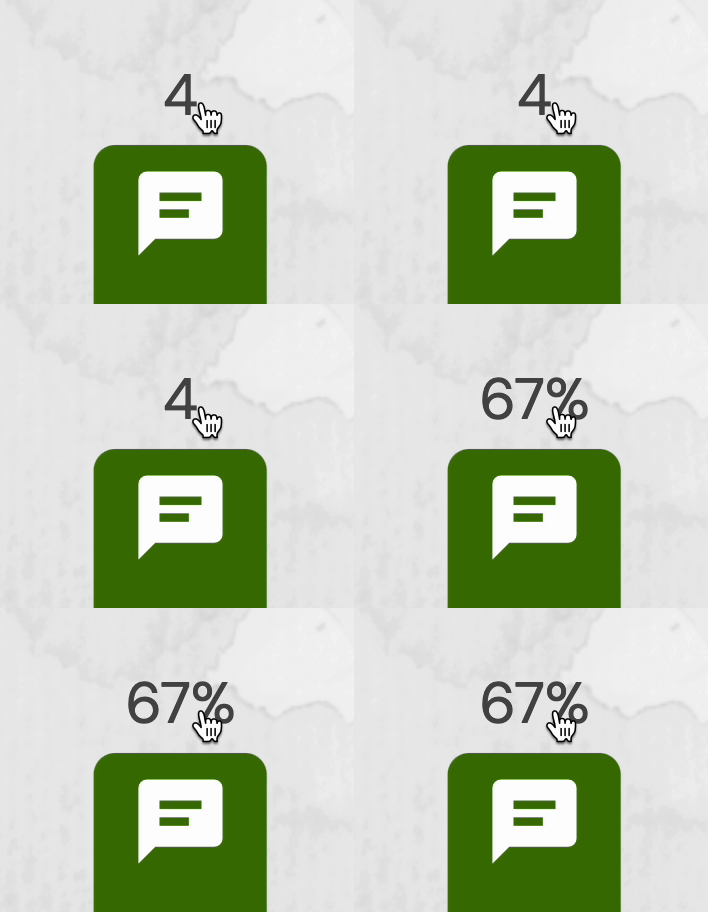
Clicking on any number allows you to toggle between viewing the results as percentages or absolute numbers.

Benefits of interacting with result displays
Get clearer insights
See precisely who chose what and read their extra comments, helping you better understand the group’s thinking.
Keep everyone engaged
Make your presentation more lively by showing detailed info on the spot, keeping your audience interested.
Flexible data views
Easily switch between percentages and numbers to show data in a way that makes sense for your audience.
See the whole picture.
Check out additional text responses along with the data to get a fuller understanding of what everyone’s thinking.
