Filter the Report
My first steps
Create a Diggle
- Interactive slides
- Content slides
- Create a test with a passing grade
- Create and run a quiz
- Customize logo
- Collaborate on content creation
- Merge slides
- Select question types
- Colors and styles
- Add images
- Custom fonts
- The Content Tab
- The Design Tab
- Import from other Diggle
- Import from PPT or PDF
- Leaderboard Calculation
- Register Participant Information (RPI)
- Quiz Points Calculation
Question types
Present live
- Present using Fullscreen
- Interactive Result Layouts
- Display the QR code
- Open and Close Submission
- Show results on devices
- Sneak Peek functionality
- Change Navigation Pace
- Hide Login Details
- Share the presentation screen
- Present on a Separate Display
- Present using Backstage
- Presentation Modes
- Navigation Modes
- Quick Onboarding
Invite participants
Results & Reports
Collaborate with others
AI - Diggle Buddy
Company Workspace
Account and settings
GDPR
Security
FAQ & Troubleshooting
- Join code has expired
- How do I use Diggle for remote learning and surveys?
- My QR code isn´t displaying
- Presentation screen is not displayed
- The leaderboard isn’t calculating scores correctly
- How do I recover a deleted Diggle or session?
- My participants are seeing the wrong slide
- How do I use Diggle for remote learning and surveys?
- How to switch between numbers and percentages
- How to interact with the result layouts
Table of Contents
Filtering your report lets you focus on specific data points, making your analysis more targeted and effective. Here’s how you can utilize the filtering options in Diggle’s Report Builder:
Access the filter panel
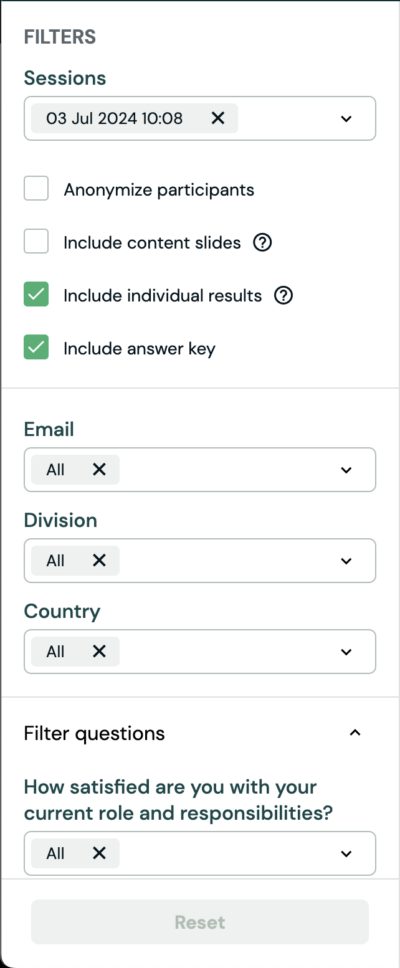
The Filter panel is located on the left side of the Report Builder. When you apply your filters, the report automatically updates.

Apply Filters
Sessions Filter
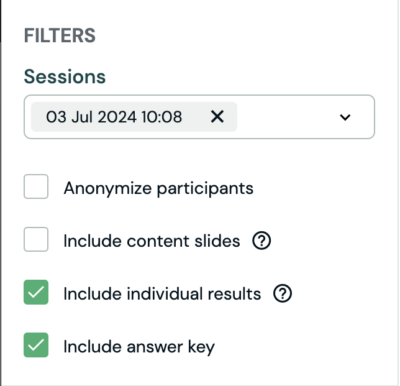
Click on the checkboxes to select multiple sessions. Then, use the “Combine Report” button to merge these sessions into one report.
Participants Filter
Enable the “Anonymize Participants” checkbox to anonymize participants, which removes their names from the report.
Content Slides
Check the “Include Content Slides” checkbox to include or exclude content slides such as videos and images.
Individual Results
Enable the “Include Individual Results” checkbox to display individual participant results. Please note that due to the potential size of the file, individual results will only be available for Excel download, not PDF or PPT.
Include answer key
Apply the “Include answer key” filter to include the correct/incorrect answer to a question where applicable.

RPI Filters
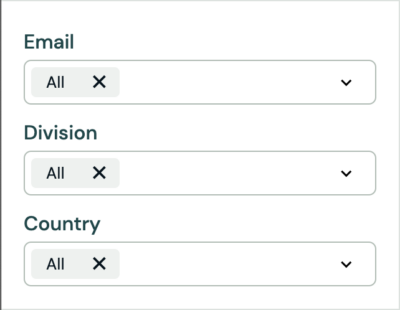
If RPI (register participant information) was used during the session, you can apply these filters based on fields set up.

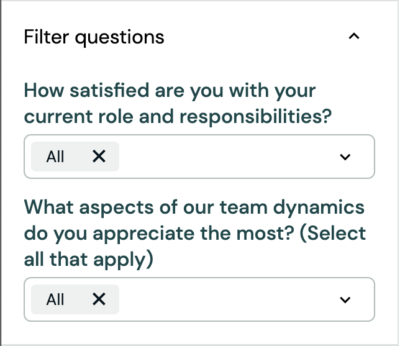
Filter questions (Multiple Choice Questions):
Use filters to focus on specific answers. For example, if participants chose “Option B” in Question 3, you can filter to see how these participants responded to other questions.

With these filtering options, you can easily tailor your report to focus on the most relevant data, giving you clearer insights and more accurate analysis.
